I’m studying digital marketing and attending Digisemestr on Saturdays in Prague. Why? Let me know if there are any mistakes, thanks!
This lesson is focused on customer care and loyalty programs. And Jindrich Faborsky, the father of Digisemestr, the man behind Marketing Festival and Reshoper, talks about his experience as conferences organizer.
Pavel – Customer analytics
Pavel talked about NPS, Pareto chart, RFM analysis and LTV prediction.
Net Promoter Score
NPS is a very simple customer survey. Ask them “How likely is it that you would recommend our company/product/service to a friend or colleague?” They rate you on a scale up to 10. The image below shows how to split customers into 3 groups based on their rating (detractors, passives and promoters).
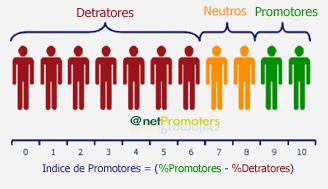
Source: upload.wikimedia.org/wikipedia/commons/7/76/Nps.jpg
Everyone who gives between 0 and 6 belongs to detractors group. They don’t like your product that much. Passives rate you 7 or 8. They are satisfied but wouldn’t recommend you. Only promoters, people who rate 9 or 10, are likely to recommend your product (or already do).
That’s nice but how do we get the score? Just subtract the percentage of detractors from promoters and you get NPS.
NPS = % promoters – % detractors
Be aware of cultural differences between different countries. In the USA people tend to rate higher compared to Germany. Similarly, people rate differently in the morning and in the evening. NPS is increased when they listen to pleasant music. NPS is different in different industries and sectors.
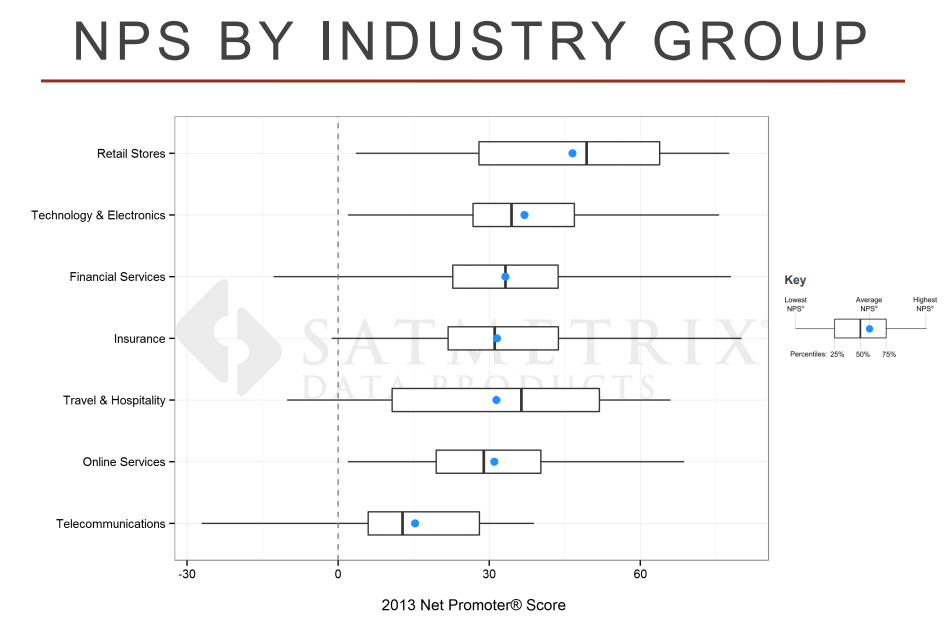
Source: NET PROMOTER BENCHMARKS – 2013 U.S. Consumer Data, SATMETRIX
NPS won’t tell you why your customers are satisfied or not. Sometimes, there is an additional input for feedback when customers score below a threshold to capture reasons behind low rating.
So is NPS good for anything? It’s good for setting a benchmark for yourself and measuring it long-term. Don’t compare your NPS with others. NPS might also help with strategic decisions.
Automate the process of collecting NPS & feedback, make it part of your customer journey to gather valuable data.
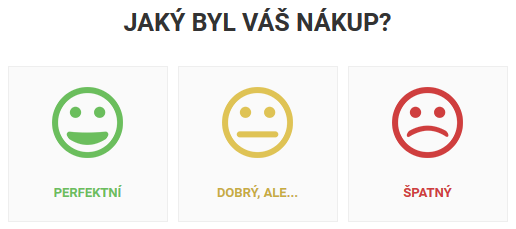
Some companies make it easier for users to collect feedback immediately (Rohlik.cz).
Customer lifecycle
Customer data aren’t perfect. People change their emails. Who is your customer (data-wise)? Companies should come up with their definition of a customer. Try to unify your customer data. The bare minimum for transaction data is date, ID, price and customer ID.
Active customer – Potentially defined by an interval between two purchases
Loyal/VIP customer – Customer who keeps coming back to shop
There are different phases of the customer lifecycle: acquisition, activation, retention. Cover all phases with different activities.
Decide which customers to focus on. Who will buy from you? If they purchase a printer, they’ll regularly need paper and cartridges. It might be expensive to acquire the customer and their first purchase might not be profitable. Only after their second or third purchase, they make you money. Pavel recommends book Customer Centricity by Peter Fader.
Measuring customer retention
It’s important to distinguish between two business models. The first model is when customers are bound by a contract. They agreed to pay a certain amount on a specific date. With this model, you know exactly how many customers you have. It’s easy to predict their LTV. Mortgage, internet, gym membership, live streaming services and other monthly subscription-based services belong here too.
The second model is without any contract. This is your standard e-commerce purchase or visiting a doctor. With this model, it’s less straightforward with counting customers. One way to do it is to segment customers in Google Analytics (GA) and see how many of ‘em buy regularly. Here are both monthly repurchase rate (MRR) and annual repurchase rate (ARR) segment configurations [archive] (The page is in Czech, click on links in bullet points and GA will open with an option to import segment configuration).
Pavel showed us many charts, for example, revenue from new vs loyal customers, seasonality, revenue by acquired year.
Cohorts
Cohorts are groups of customers having something in common. Like their acquisition date. What can you use it for? Let’s say that in March you run an acquisition campaign. You can compare metrics for new customers from March with new customers from other months and see whether they purchase more, what’s their retention, etc. Basically, how valuable they are. Poor stats in March? Maybe your acquisition campaign brought less qualified visitors that month. Targeting was wrong? Or you might need to improve your communication?
Check out Cohort Analytics reporting in GA.
Revenue cohorts can be used to set the acquisition price. If you know they spend only 30% in their first month and later they spend the rest, you know their LTV. Retention is important. Higher acquisition costs are worth it if customers stick around. It’s much easier to sell FIFA 19 to customers who already bought FIFA 17 from you than to Minecraft players.
RFM
RFM is segmentation of customers based on recency, frequency and monetary value of their purchase(s).
Recency – days from their last purchase
Frequency – how many times per year they purchase
Monetary value – how much money they make us
The very basic segmentation is to divide your customer into four groups like this:
| No. of purchases | Many | Gone cold | Top value |
| Few | Needs development | Raise value | |
| Long time ago | Recently | ||
| Days since last purchase | |||
If you want to be more granular, the number of segments increases rapidly. For example, with 3 segments for each parameter it’s 3 x 3 x 3 = 27 segments. That’s a lot. Furthermore, some platforms have lower limits for the audience size. You need at least hundreds of customers in each segment. If you do this enables you to perform A/B tests and fiddling with custom audiences on FB. Keep a reasonable number of segments with enough customers in each..Name your segments to quickly distinguish who they are (eg. Cheapskates). With RFM you can predict the probability of their next purchase thanks to statistics. Be careful about the data interpretation though. Sometimes, for example, you might think you see a downward trend of a purchase metric but it’s decreasing only because more recent customers didn’t have a chance yet to purchase again.
Often the marketing department doesn’t have access to see revenue data. This is a problem. Many marketing activities are some sort of revenue optimization. Marketing is involved in the immediate optimization of conversions (CPA), through ROAS (optimizing revenue), profit (optimizing ROI) to long-term CLV/LTV.
Pareto chart
Marketing should allocate resources to focus on the most valuable segments of customers. Spend only as much as each customer type is worth. Don’t overinvest on low-value customers. And spend enough on valuable customers.
In Pareto chart customers are sorted based on their value. The curve shows their cumulative sales/profit. Some customers are unprofitable (marked red). This is why the curve starts to fall down.
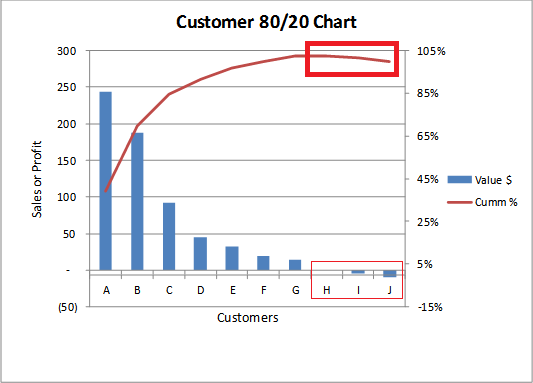
Source: SIMAFORE has a nice article about Pareto chart and customer segments [archive].
Pareto chart is great because it visually shows us how much we depend on a percentage of customers to makes us money. This is called Stobachoff index. Sometimes, you might depend on a small number of customers. Take care of them – give them priority support, etc.
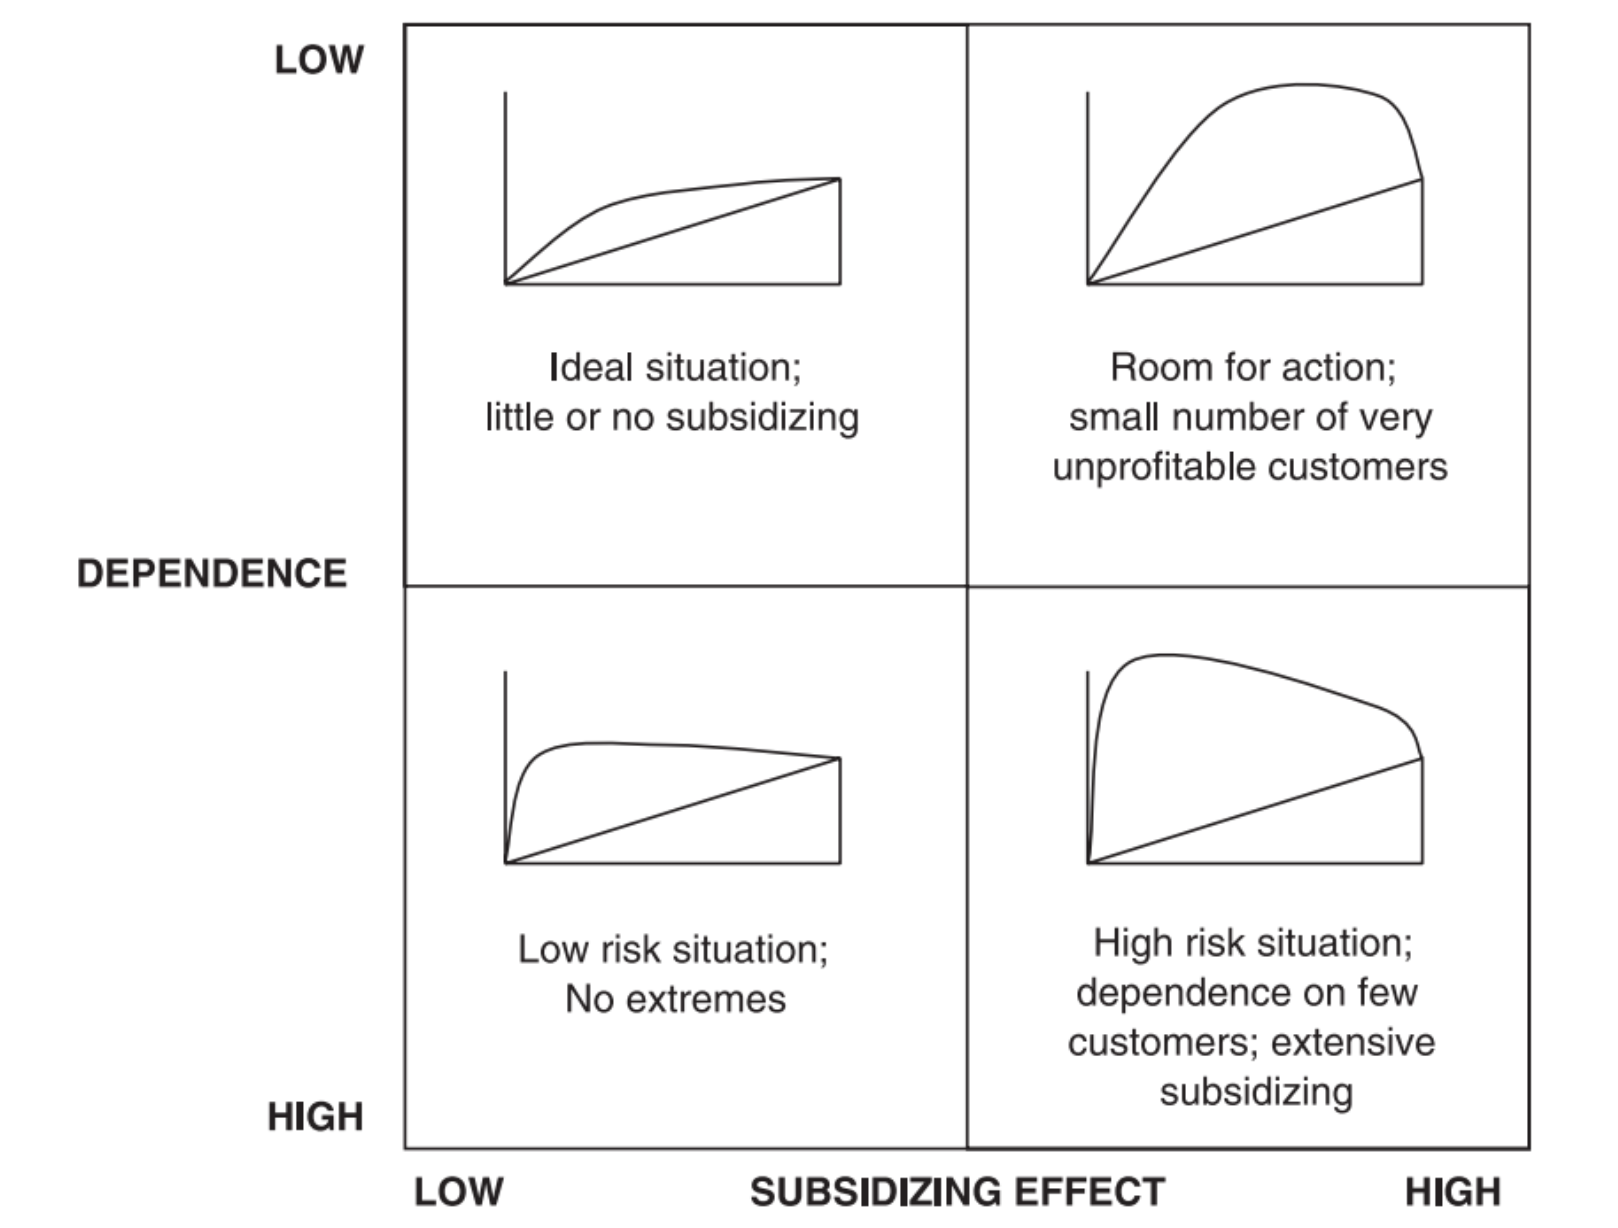
We can divide the curve into multiple regions and for each segment of customers (based on their profitability) focus on a different goal. For example, invest heavily into the acquisition of valuable customers (beginning of the curve), increase purchase frequency of the middle section and to diminish unprofitable customers at the end of the curve.
Try to find out what differentiates customers in each part of the curve, how did we acquired them, how did we communicate with them, etc. For example, we might have acquired unprofitable customers from different keywords than the rest. Understand why before you start getting rid of them.
Customer Lifetime Value (CLV)
CLV is for predicting how much profit is a particular customer going to make you in the future. You need to know who is your customer (define your customer).
They might be visiting you regularly every month. If the trend continues, their CLV is pretty high. Someone could’ve been buying every week but stopped. You can’t expect them to shop again. Their CLV is lower.
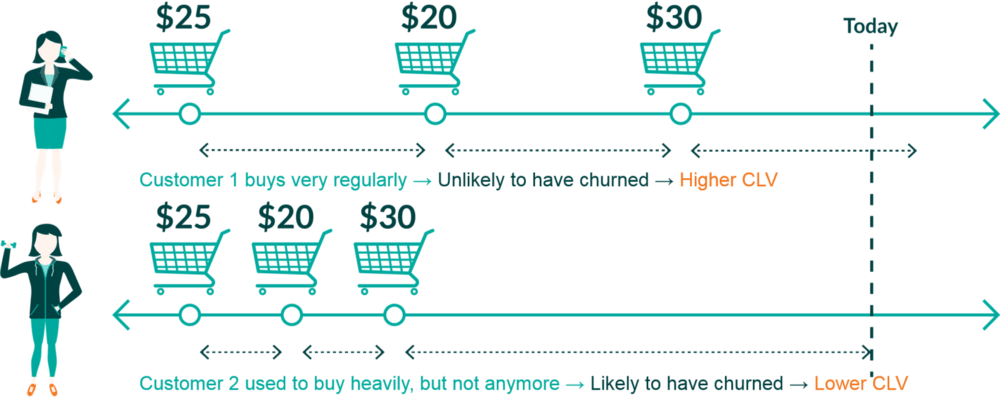
Source: https://techburst.io/heres-how-little-data-you-need-to-calculate-customer-lifetime-value-d45e767089aa
How far into the future can you predict? Shopping cycles are different in every industry. People buy tires about every 4 years, mortgages are fixed for 20-30 years, insurance is based on life expectancy. Typically, you can predict 1-2 years for regular e-commerce.
What do you need for CLV? Customer identification (ID in CRM system), their historical value (to predict future value) and profit (incl. conversions, revenue).
Why is CLV cool? With it, you know much will customer potentially spend. This helps to come up with an effective price for customer acquisition and retention. Import CLV segments to GA and to ad systems (incl. remarketing lists). In direct marketing, you can assign a rating/score for customers (for emailing, contests, bonuses, etc.). Identify channels which bring the most valuable customers. Exclude unprofitable customers from communication.
One of the models for CLV is Pareto/NBD (EP/NBD). It calculates the probability that customer “stays alive” and their CLV based on RFM. Other models are Status Quo, MC and VAR. For each model, you can compare the predicted value and the actual value to find the most accurate model (and the most practical one, as some models require larger and harder to obtain datasets).
Your actual experience with CLV depends on what data you collect and whether you’re able to pair CRM data with data on your marketing platform. For example, customer match for email.
Radek – Customer loyalty programs
Radek has a lot of experience with loyalty programs – over 18 years!. Loyalty is dead. People are unfaithful creatures. Oaths are a way how to make people commit, however, that’s a bit tricky to do with loyalty programs.
Why are people unfaithful?
Sea of sameness – every loyalty program is the same, they copy from each other.
Proliferation – customers suffer from analysis paralysis from the sheer choice they are being offered.
The customer lifecycle is clear. Eventually, customers will move on. With loyalty programs, we can only prolong their stay with us. Nevertheless, the end is inevitable. About 70% of customers don’t have a need or reason to come back (or they forget) and they account for 45% revenue. There is 30% of returning customers who make 55% in revenue.
https://twitter.com/i/web/status/938464806281138177
The profit is generated by returning customers. So is it about the loyalty of customers? No. It’s the responsibility of companies to put in the effort. Companies should be loyal to their customers.
Customers act on impulse while believing they carefully thought it through with logic. Emotions rule – hatred, envy and love. Too rational marketing campaigns without emotions don’t work.
Understand your customer. Visit them personally in their natural habitat. Market research studies are adding an extra layer of separation from the truth. They skew the results and often show only one side of the coin.
The iron rule says the first customer order unprofitable. Second order barely covers the acquisition. Third order generates profit. High customer loyalty is highly profitable. And you can charge more too. Remember iPhone?
How do we make customers keep coming back? Dopamine. People love rewards. It changes their behavior. When the reward is too far, we give up, however, as the reward is getting closer our effort to reach it increases. This is called Goal gradient effect. This is one of the reasons why loyalty cards fail. It feels like a loooong way to get to the 10th punch/stamp/sticker/etc.
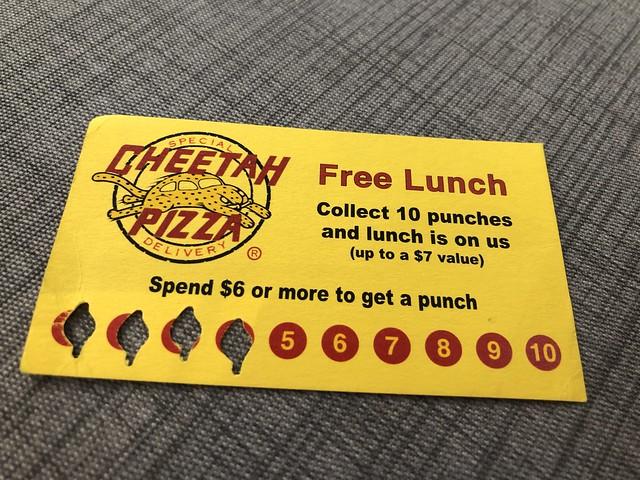
Cheetah Pizza loyalty card, source: https://www.flickr.com/photos/dmuth/31117253398
The golden rule of good customer reward says it must be related to the brand, brings a good feeling to the customer and motivates them to change their behavior.
Loyalty programs categorization
Obvious/disclosed vs Hidden/Undisclosed
Differentiated by the existence of a public reward scheme.
Short-term vs Continuous
Short-term programs are often without registration and connected to some sort of contest. Watch out for yo-yo effect as customers lose interest once the reward is gone.
With points/currency vs Without points/currency
Usually, loyalty programs use points. Points and different currency shifts away focus from the actual price of products. The good motivational scheme is needed.
Status vs Without status
Giving customers different levels of service based on their status. Status programs work better for services and less frequent shopping. More suitable for men as they prefer status. Hotels and airlines often use status programs.
Paid vs Free
Customers who regularly pay for their membership in a loyalty program have a deeper interest in a service, they want more (status, permanent discounts or other advantages) or they want to differentiate themselves. Payment is a form of commitment for customer so they stick around (they are already invested).
Partner vs Coalition
Partner programs are formed when many different individual companies join together to provide services within one common loyalty program. Coalition programs are a more close collaboration of several companies as they usually share data about customers, have cross-promotions, etc.
Sadly, people actively participate in only 50% of loyalty programs they are members of. Programs lack originality, transparency and honesty.
Don’t push the loyalty program upon your customer until they make their purchase. So start with branding and performance marketing first. Provide quality service – make sure customers are satisfied, your communication is well put together and they got a reason to come back. Membership in a loyalty program must somehow improve customers life (provide benefit, eg. discount on shipping). Only after their next purchase, they can get their first reward.
3 pillars of a successful loyalty program
Rewards, functional loyalty and emotions.
Rewards are sweet. When you make customers’ lives better they stay loyal. Gamification techniques are one way to provoke emotions.
Personalization increases customer’s interest. They care about themselves. One example is to send them an email with their service usage stats. Think about the timing too. When will the customer be ready and willing to hear from you?
Customer care begins with a purchase. Take care of them. Returning customers generate profits. And friends are your best marketers.
Jindrich – Marketing conferences organization
Jindrich is the founder of Marketing Festival conference. Here are lessons learned.
Speakers
There are different types of speakers. Some do it for free, some are willing to pay for speaking, there are expensive professional speakers and then there are people who are skilled experts in their field and get invited to speak. Some speakers only want to promote themselves or their company/product.
Professional speakers often lack motivation, negotiation is done through an agency, they have one topic and talk about it at every event they speak at. They charge up to $250k.
Sometimes prospective speakers lack credentials. They publish one ebook and believe/pretend they are SME. Looking for speakers is about contacts from previous conferences, personal references and connections.
Content
It’s funny but often people don’t care about the content at all. They attend to meet people, collect leads or close deals. Nevertheless, working with speakers to bring the best content available improves conference experience (eg. speaker is used to present to tech experts but the conference is for business people, or another way around – presentation might need to be tweaked). FOMO is often a driver behind conference ticket purchase.
Venue
Venues need to be booked many months (12-18) in advance. There are only a few 1000+ seats venues in the Czech Republic. International speakers only know a few cities in your country, don’t make them travel to an unknown location.
Communication
Marketing Festival ran a highly personalized video marketing campaign. Check out the video:
Videos were personalized to include customer’s name, number of previous visits, their company, interests and whether they already bought a ticket. People were sharing these videos like crazy and that brought a lot of traffic to the conference website.
Team
How to choose team members? They need inner motivation & passion. Conferences are not rocket science. Think like a manager – hire students to help with standalone online tasks (eg. submitting posts to promote the conference in social media groups).
That’s all folks, have a great day!
Note: I’m traveling this week so the next Digisemestr post will be delayed!